The headline numbers (year to June 2026)
| Tests taken | Passed | Pass rate | |
|---|---|---|---|
| All tests | 425,612 | 322,949 | 75.9% |
| For settlement (ILR) | 227,800 | 186,629 | 81.9% |
| For citizenship | 195,583 | 134,819 | 68.9% |
| Other (research, journalism, academic) | 2,224 | 1,501 | 67.5% |
Source: Home Office (UK Visas and Immigration), table LUK_01, read 31 October 2026.
- Change on the year before: 302,520 tests in the year to June 2025, so the number of tests went up by 40.7%. The pass rate then was 70.9%.
- Busiest quarter on record: January to March 2026, with 126,822 tests.
The Home Office publishes one row per quarter. We added up the four quarters from Jul-Sep 2025 to Apr-Jun 2026 ourselves. The figures were published on 27 August 2026.
Pass rate by year
Show the numbers
| Year | Pass rate |
|---|---|
| 2011 | 77.1% |
| 2012 | 85.2% |
| 2013 | 76.8% |
| 2014 | 60.9% |
| 2015 | 60.9% |
| 2016 | 64.6% |
| 2017 | 70.4% |
| 2018 | 80.5% |
| 2019 | 81.7% |
| 2020 | 79% |
| 2021 | 72.4% |
| 2022 | 68.5% |
| 2023 | 69.3% |
| 2024 | 70.5% |
| 2025 | 74.1% |
The lowest year was 2014, at 60.9%. The highest was 2012, at 85.2%. The data doesn't say why rates went up or down, so we don't guess.
Show the numbers
| Year | Tests taken |
|---|---|
| 2011 | 179,849 |
| 2012 | 151,036 |
| 2013 | 152,457 |
| 2014 | 165,738 |
| 2015 | 174,923 |
| 2016 | 133,490 |
| 2017 | 130,983 |
| 2018 | 159,566 |
| 2019 | 170,061 |
| 2020 | 172,973 |
| 2021 | 198,586 |
| 2022 | 199,728 |
| 2023 | 276,998 |
| 2024 | 317,555 |
| 2025 | 347,203 |
| Year | Tests taken | Pass rate, all tests | Pass rate, settlement | Pass rate, citizenship |
|---|---|---|---|---|
| 2016 | 133,490 | 64.6% | 65.7% | 63.8% |
| 2017 | 130,983 | 70.4% | 72.0% | 69.5% |
| 2018 | 159,566 | 80.5% | 82.5% | 79.2% |
| 2019 | 170,061 | 81.7% | 83.8% | 80.2% |
| 2020 | 172,973 | 79.0% | 80.1% | 78.4% |
| 2021 | 198,586 | 72.4% | 74.8% | 70.9% |
| 2022 | 199,728 | 68.5% | 72.7% | 65.4% |
| 2023 | 276,998 | 69.3% | 74.8% | 64.4% |
| 2024 | 317,555 | 70.5% | 75.7% | 65.5% |
| 2025 | 347,203 | 74.1% | 79.5% | 69.0% |
| Year to June 2026 | 425,612 | 75.9% | 81.9% | 68.9% |
Source: Home Office (UK Visas and Immigration), table LUK_01, read 31 October 2026.
Show every year since 2010
| Year | Tests taken | Pass rate | Settlement | Citizenship |
|---|---|---|---|---|
| 2010 (part year: Apr-Jun 2010 to Oct-Dec 2010) | 137,995 | 72.9% | 76.5% | 69.1% |
| 2011 | 179,849 | 77.1% | 81.4% | 71.9% |
| 2012 | 151,036 | 85.2% | 86.8% | 82.7% |
| 2013 | 152,457 | 76.8% | 78.5% | 74.6% |
| 2014 | 165,738 | 60.9% | 63.8% | 56.9% |
| 2015 | 174,923 | 60.9% | 65.3% | 57.2% |
| 2016 | 133,490 | 64.6% | 65.7% | 63.8% |
| 2017 | 130,983 | 70.4% | 72.0% | 69.5% |
| 2018 | 159,566 | 80.5% | 82.5% | 79.2% |
| 2019 | 170,061 | 81.7% | 83.8% | 80.2% |
| 2020 | 172,973 | 79.0% | 80.1% | 78.4% |
| 2021 | 198,586 | 72.4% | 74.8% | 70.9% |
| 2022 | 199,728 | 68.5% | 72.7% | 65.4% |
| 2023 | 276,998 | 69.3% | 74.8% | 64.4% |
| 2024 | 317,555 | 70.5% | 75.7% | 65.5% |
| 2025 | 347,203 | 74.1% | 79.5% | 69.0% |
| 2026 (part year: Jan-Mar 2026 to Apr-Jun 2026) | 224,663 | 75.8% | 82.0% | 67.7% |
The last eight quarters
| Quarter | Tests taken | Pass rate | Settlement (pass rate) | Citizenship (pass rate) |
|---|---|---|---|---|
| Jul-Sep 2024 | 78,768 | 71.4% | 38,975 (76.6%) | 39,466 (66.3%) |
| Oct-Dec 2024 | 77,498 | 69.3% | 38,159 (74.1%) | 39,014 (64.6%) |
| Jan-Mar 2025 | 74,707 | 70.1% | 32,964 (74.6%) | 41,437 (66.7%) |
| Apr-Jun 2025 | 71,547 | 72.9% | 35,036 (77.3%) | 36,202 (68.7%) |
| Jul-Sep 2025 | 88,529 | 75.7% | 47,811 (81.7%) | 40,229 (68.7%) |
| Oct-Dec 2025 | 112,420 | 76.2% | 52,352 (82.0%) | 59,472 (71.1%) |
| Jan-Mar 2026 | 126,822 | 76.1% | 68,720 (82.7%) | 57,416 (68.3%) |
| Apr-Jun 2026 | 97,841 | 75.5% | 58,917 (81.1%) | 38,466 (66.9%) |
Source: Home Office (UK Visas and Immigration), table LUK_01, read 31 October 2026.
Show every quarter since Apr-Jun 2010
| Quarter | Tests taken | Passed | Pass rate |
|---|---|---|---|
| Apr-Jun 2026 | 97,841 | 73,834 | 75.5% |
| Jan-Mar 2026 | 126,822 | 96,482 | 76.1% |
| Oct-Dec 2025 | 112,420 | 85,620 | 76.2% |
| Jul-Sep 2025 | 88,529 | 67,013 | 75.7% |
| Apr-Jun 2025 | 71,547 | 52,140 | 72.9% |
| Jan-Mar 2025 | 74,707 | 52,405 | 70.1% |
| Oct-Dec 2024 | 77,498 | 53,691 | 69.3% |
| Jul-Sep 2024 | 78,768 | 56,272 | 71.4% |
| Apr-Jun 2024 | 75,191 | 52,914 | 70.4% |
| Jan-Mar 2024 | 86,098 | 61,051 | 70.9% |
| Oct-Dec 2023 | 68,672 | 47,532 | 69.2% |
| Jul-Sep 2023 | 74,744 | 52,789 | 70.6% |
| Apr-Jun 2023 | 70,304 | 49,210 | 70.0% |
| Jan-Mar 2023 | 63,278 | 42,473 | 67.1% |
| Oct-Dec 2022 | 49,752 | 33,653 | 67.6% |
| Jul-Sep 2022 | 49,205 | 33,727 | 68.5% |
| Apr-Jun 2022 | 48,470 | 33,036 | 68.2% |
| Jan-Mar 2022 | 52,301 | 36,339 | 69.5% |
| Oct-Dec 2021 | 43,354 | 29,999 | 69.2% |
| Jul-Sep 2021 | 46,427 | 32,700 | 70.4% |
| Apr-Jun 2021 | 53,456 | 39,348 | 73.6% |
| Jan-Mar 2021 | 55,349 | 41,790 | 75.5% |
| Oct-Dec 2020 | 57,900 | 44,197 | 76.3% |
| Jul-Sep 2020 | 57,128 | 45,800 | 80.2% |
| Apr-Jun 2020 | 16,653 | 13,893 | 83.4% |
| Jan-Mar 2020 | 41,292 | 32,834 | 79.5% |
| Oct-Dec 2019 | 39,657 | 31,987 | 80.7% |
| Jul-Sep 2019 | 39,207 | 32,407 | 82.7% |
| Apr-Jun 2019 | 40,185 | 32,242 | 80.2% |
| Jan-Mar 2019 | 51,012 | 42,287 | 82.9% |
| Oct-Dec 2018 | 43,126 | 35,108 | 81.4% |
| Jul-Sep 2018 | 38,523 | 31,329 | 81.3% |
| Apr-Jun 2018 | 38,325 | 30,703 | 80.1% |
| Jan-Mar 2018 | 39,592 | 31,281 | 79.0% |
| Oct-Dec 2017 | 33,034 | 24,342 | 73.7% |
| Jul-Sep 2017 | 32,003 | 23,439 | 73.2% |
| Apr-Jun 2017 | 30,923 | 21,079 | 68.2% |
| Jan-Mar 2017 | 35,023 | 23,304 | 66.5% |
| Oct-Dec 2016 | 28,072 | 17,577 | 62.6% |
| Jul-Sep 2016 | 34,513 | 23,212 | 67.3% |
| Apr-Jun 2016 | 34,006 | 21,469 | 63.1% |
| Jan-Mar 2016 | 36,899 | 23,920 | 64.8% |
| Oct-Dec 2015 | 39,744 | 23,505 | 59.1% |
| Jul-Sep 2015 | 46,705 | 28,492 | 61.0% |
| Apr-Jun 2015 | 45,021 | 27,373 | 60.8% |
| Jan-Mar 2015 | 43,453 | 27,160 | 62.5% |
| Oct-Dec 2014 | 38,462 | 23,232 | 60.4% |
| Jul-Sep 2014 | 39,673 | 23,833 | 60.1% |
| Apr-Jun 2014 | 44,559 | 26,436 | 59.3% |
| Jan-Mar 2014 | 43,044 | 27,457 | 63.8% |
| Oct-Dec 2013 | 38,209 | 26,242 | 68.7% |
| Jul-Sep 2013 | 38,034 | 28,264 | 74.3% |
| Apr-Jun 2013 | 26,366 | 19,434 | 73.7% |
| Jan-Mar 2013 | 49,848 | 43,185 | 86.6% |
| Oct-Dec 2012 | 32,349 | 27,646 | 85.5% |
| Jul-Sep 2012 | 41,533 | 35,918 | 86.5% |
| Apr-Jun 2012 | 35,354 | 30,066 | 85.0% |
| Jan-Mar 2012 | 41,800 | 35,079 | 83.9% |
| Oct-Dec 2011 | 37,130 | 30,082 | 81.0% |
| Jul-Sep 2011 | 39,340 | 31,906 | 81.1% |
| Apr-Jun 2011 | 48,898 | 36,694 | 75.0% |
| Jan-Mar 2011 | 54,481 | 39,962 | 73.4% |
| Oct-Dec 2010 | 46,024 | 32,891 | 71.5% |
| Jul-Sep 2010 | 45,032 | 33,150 | 73.6% |
| Apr-Jun 2010 | 46,939 | 34,505 | 73.5% |
What the numbers mean, and what they don't
- They count tests, not people. Someone who takes the test twice is counted twice. So these figures can't give a “first-time pass rate”. Nobody can work that out from the published table.
- Settlement or citizenship is the reason given for taking the test. It doesn't describe the person.
- The data comes from the test provider. The table's own note says: “Data regarding Life in The UK Test Data are based on defined reports supplied and reconciled by PSI Services and are not subject to detailed checking by the Home Office.”
- How we worked out the rates. We worked out each pass rate from the published counts (passed ÷ taken), to one decimal place. The table also prints its own pass-rate column, rounded to whole numbers in early years. Where the two differ, we use the counts. For January to March 2026, the printed rate for all tests is 70.1%, but its own counts give 76.1%. A few rows also have small differences between the total and the sum of the three groups.
- No breakdown by nationality, age, test centre or language is in this table.
The test itself, in one paragraph
The test has 24 questions in 45 minutes. To pass, you need 75% or more, which is 18 correct answers. It costs £50, and you book at least 3 days ahead. GOV.UK says there are over 30 test centres in the UK. If you don't pass, GOV.UK says: “You can rebook the test as many times as you need. You'll have to pay each time.” The questions come only from the official handbook, Life in the United Kingdom: A Guide for New Residents.
Source: GOV.UK: Life in the UK Test, read 31 October 2026.
When this page updates
The next Home Office release, Migration transparency data, Q3 2026, is due on 26 November 2026. It should add July to September 2026 to the table. We plan to update this page when it comes out.
Data: table LUK_01, published 27 August 2026, covering Apr-Jun 2010 to Apr-Jun 2026.
Common questions
What is the Life in the UK test pass rate?
75.9% of tests taken in the year to June 2026 were passed (Home Office table LUK_01).
What percentage of people pass the Life in the UK test the first time?
The Home Office figures count tests, not people. So a first-time pass rate can't be worked out from them. Any first-time figure you see elsewhere is an estimate.
What is the Life in the UK test fail rate?
In the year to June 2026, 24.1% of tests taken were not passed: 102,663 of 425,612.
How many questions can you get wrong?
You need 75% of 24 questions, which is 18 correct answers. So you can get up to 6 wrong and still pass.
How many people take the Life in the UK test each year?
425,612 tests were taken in the year to June 2026, and 347,203 in 2025. These are counts of tests, not people.
Is the pass rate different for settlement and citizenship?
Yes. In the year to June 2026, 81.9% of settlement tests were passed, against 68.9% of citizenship tests.
Where does this data come from?
From the Home Office's quarterly UK Visas and Immigration transparency data, table LUK_01. The next update is expected on 26 November 2026.
Sources
We read each of these on the date shown and last checked this page on 31 October 2026.
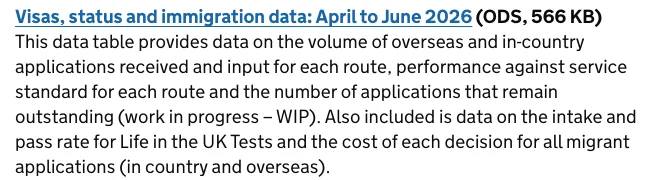
- Home Office: Visas, status and immigration data: April to June 2026 (ODS), table LUK_01 read 31 October 2026
- GOV.UK: Migration transparency data read 31 October 2026
- GOV.UK: Migration transparency data, Q3 2026 (release announcement) read 31 October 2026
- GOV.UK: Life in the UK Test read 31 October 2026
- GOV.UK: Life in the UK Test, What happens at the test read 31 October 2026
Update log
- First published.